
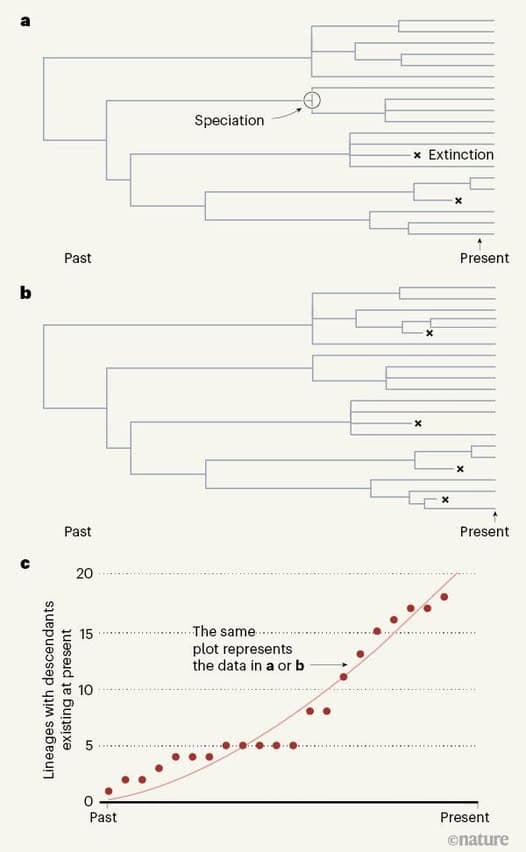
The slope of the curve in this chart is called lambda , which is the rate of total speciation, and is equal to the difference between the rate of speciation (symbolized by b of birth) and the rate of extinction (symbolized by d of death). It is expressed by the following equation:
The slope of the curve in this chart is called lambda , which is the rate of total speciation, and is equal to the difference between the rate of speciation (symbolized by b of birth) and the rate of extinction (symbolized by d of death). It is expressed by the following equation:
λ=b-d
But the difficulty lies in estimating b and d, because if we have only the number of species that survive in the present, as in our example of six thousand six hundred birds, any pair of b and d that gives the same value will produce the same strain curve over time and there are an infinite number of such pairs.
Mark Beagle writes in the News and Opinions section of this paper in Nature that "Luca and Bennell's result will discourage evolutionists looking for a link between speciation levels and past extinctions with...historical events."[2]
The circular logic of evolutionists states that "Assumptions can be made about how speciation and extinction change with each other over time or with the number of species, but they are originally assumptions about things we want to estimate."[2]
- Dr. Mohammed Al-Qadi
More: https://braheen.com/articles/evolution-design/الأشجار-التطورية-عاجزة-عن-إثبات-صحة-السيناريوهات-التطورية
—
Source: Published on Facebook's "Braheen Center" page